
The arbitrarily poor

I have no idea
I have no idea
Quico and I had a non-quibble a few days ago about poverty. I criticized poverty measures, and he beat me up about it.
Truth is that I agree with him. Poverty is a very complex thing with many definitions: income, savings, choices, and even expenditure. People have tried to package it in a single indicator, but numbers end in utter failure and, in many cases do more harm than good.
I think that’s also the case when talking about Unmet Basic Needs (UBN) but it is also true when looking at a line and defining poor people as all those who fall below that line. For example, when one goes out to create policy whose intent is to bring kids from farms and into classrooms where they learn nothing, then you do a disservice to society. You end up having adults that don’t know how to read, nor work on a farm. But hey! It looks great when you see the percentage of kids attending school going up.
And don’t get me started on the lack of an electric grid, and lack of regulation enforcement that causes fires and ends up killing children. I think Quico’s argument about poverty measures being the best there is … is rather conformist. UBN may be the best available, but the way we measure each can be greatly refined, and those tools are out there.
Defining poverty in terms of income is, at best, arbitrary. What does $2/day mean exactly? Poverty lines are typically constructed by some required caloric intake, in some other cases you add some other goods and services, and that’s it. In Venezuela, it is based on “la Canasta Alimentaria.” A multiplier of that creates the “Canasta Basica.” The first defines extreme poverty, and the second, plain old poverty.
But in the words of Lant Pritchett, the line is arbitrary: “no one celebrates crossing the poverty line”. This number means even less when backward policy-making and government subsidies distort them. But instead of me telling you about it, let’s play making policy. Let’s look at the year 2005. Figure 1 shows the monthly income per capita distribution in Venezuela.
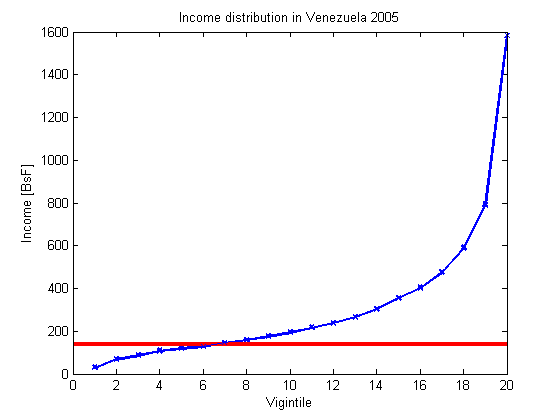
Figure 1. (a) blue line: income distribution (b) red line: poverty line. Source BCV.
This shows the income inequality in Venezuela. It also shows the poverty line, and the percentage of people below it. But what would be fair? How would you redistribute this? Well, the government has been trying to do it better … with mixed results.
The graph also shows the limitations in the measurement. Consider first household income.
To get the per capita figure you must divide by the number of people in that household. This creates a distortion, particularly in high income households where there is one member of the family (typically the father, but not limited to) who makes most of the income lifting everyone out of poverty. The children, in turn, can be very well in their twenties, college graduates, and working in companies yet still living with their parents. If they would pursue independence, the result in the graph is that the remaining rich household members became richer, and the detached children are now poorer. We don’t see this happening frequently as middle-upper because when they de-attach, in many cases they emigrate or start with a humongous amount of help from their parents when they marry. But you get a sense to how sensitive the measurements are.
Let’s talk about the GINI coefficient and how the government policies show it to be more equal, but also how they selectively tinker with it. Figure 2 is taken from a presentation outlining the results of the National Census of Household Budget (Encuesta Naciona de Presupuesto Familiar 2005). In it, basically we can see a “traditionally” calculated GINI and how, by assigning some cash value to the social programs and “pretending” to transfer that cash to the people, you move from one GINI index, to another one.
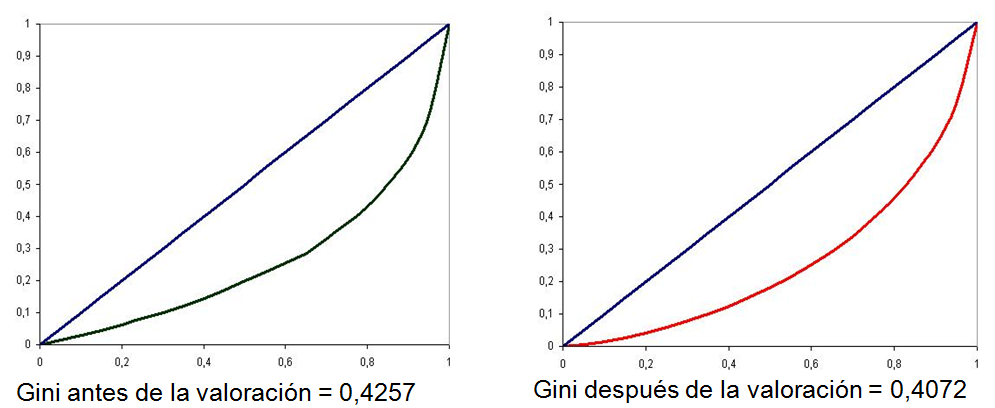
Figure 2. GINI Coeff before and after “adjustment”. Source BCV. ENPF 2005
But what social programs are those? The truth is that it includes only misiones. For instance it doesn’t include public education, particularly higher education, which benefits more the middle and upper classes. It doesn’t include the gas subsidy, with its horrible subsidies to the rich, making our imcome distribution more regressive.
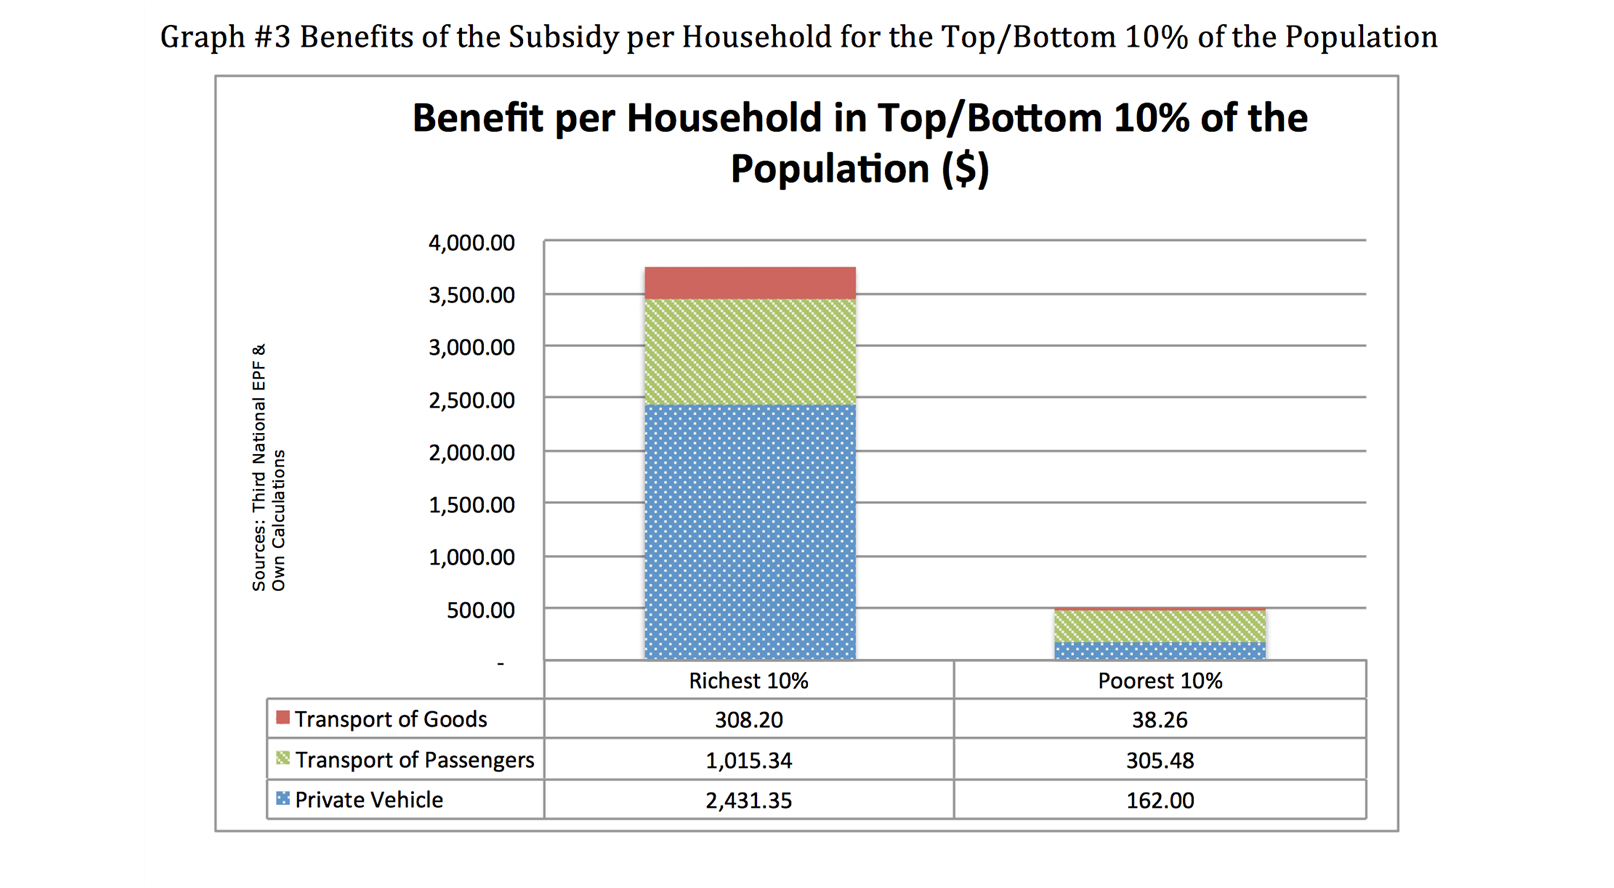
Figure 3. Gas subsidy benefits. Barrios and Morales, 2012
What would the GINI be if you universally apply the same methodology on all social programs? I don’t know. But I think we should.
Now let’s say that we do distribute oil wealth universally using an scheme like the one shown here. Well, we get a shift that roughly looks like this:
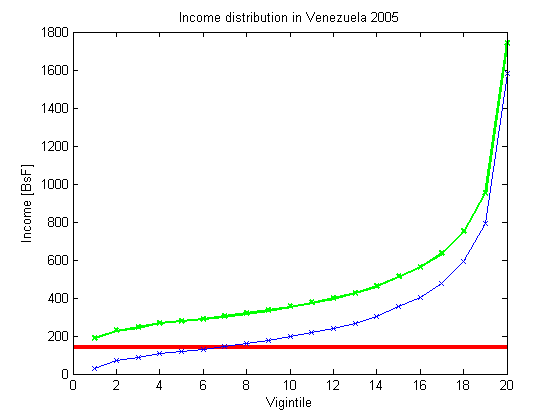
Figure 4. (a) green line: Income plus oil income UCT (b) blue line: Income with no UCT (c) red line: poverty line
Very nice! No one is poor by the pretty much arbitrary standard of the poverty line. We could also establish the poverty line as the amount of money required to get 2,100 calories with sugar. If we do that, there wouldn’t be any poverty.
The question that arises is: is this true development? Maybe.
If we do this, but other structural aspects of the economy aren’t fixed – scarcity, poor supply of basic services to the poor, etc – would we improve the life of the poor? Perhaps. Would we do more if instead of UCTs we pursued infrastructure investment to improve those UBNs indicators? Maybe, if done well. Very important questions all of them, and they boil down to how much we want government (and the people employed in it) doing.
Why is this so important?
Well, poverty reduction has been a flagship for chavismo, one that has kept the idea that this sinking ship is, after all, still a viable, worthwhile project.
The data seems to agree with them, unless we look further and see the meaningless information that they provide if one doesn’t see the whole picture. The “canasta basica” is today 4.8X the minimum wage. Soon new poverty figures should be published, and I am sure there are a lot of people in the BCV and INE trying to figure out how to make this more palatable, and we as readers must understand what lies behind this figures (or what lies are in those numbers?). The whole picture is looking bleak.
Ultimately, a healthy, skeptical attitude to any poverty measure is always worthwhile, whatever your political inclinations.
Caracas Chronicles is 100% reader-supported.
We’ve been able to hang on for 21 years in one of the craziest media landscapes in the world. We’ve seen different media outlets in Venezuela (and abroad) closing shop, something we’re looking to avoid at all costs. Your collaboration goes a long way in helping us weather the storm.
Donate

